Northwest Reefer Rejections Spike as the Midwest Stays Tight
- Cargo
- Electric Vehicles
- Shipped
- Shipper
- Zach Strickland, FW Market Expert & Market Analyst
- Readers
- 646
National tender rejections average about 13.8%, but the Northwest hit 20.27% on harvest reefer demand while the Midwest stays tight across equipment types.
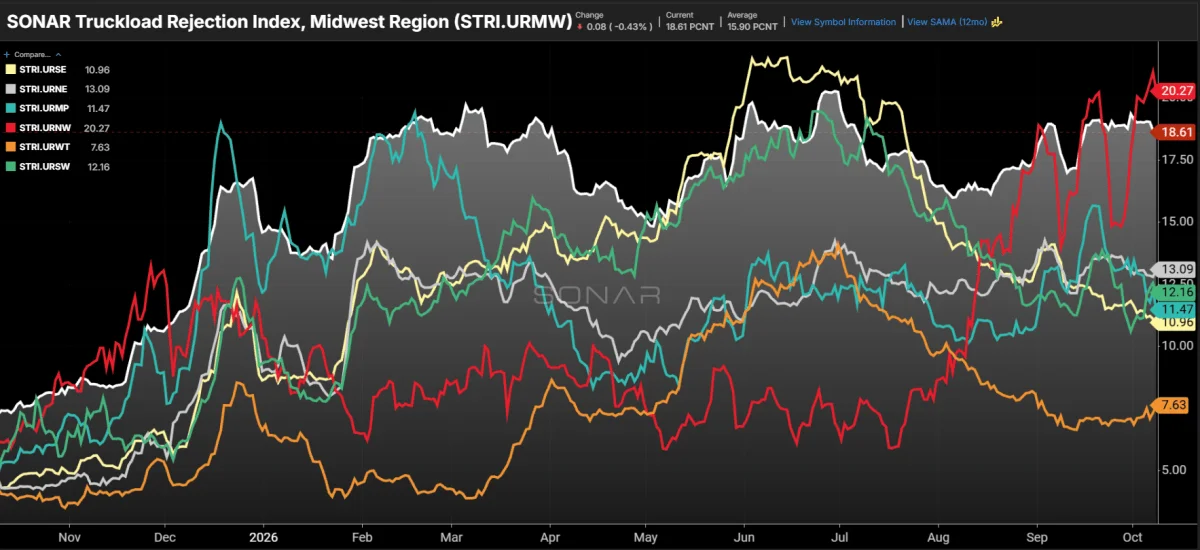
The national tender rejection rate has eased to about 13.8% over the past two weeks, but that average is hiding two very different problems. The Northwest posted a 20.27% rejection rate on Oct. 8, more than triple the 6.2% it recorded a year earlier and the highest of any region. The Midwest isn't far behind at 18.61%. Every other region sits between 7.6% and 13.1%, and most of them are flat or drifting lower.
Both leaders are tight, but they got there by different routes. The Northwest is in a sudden surge driven by refrigerated freight that started in August. The Midwest has been the tightest large region for most of the year and shows no sign of loosening. For carriers and shippers, the two cases call for different responses.
The Northwest flipped in eight weeks
For most of the year, the Northwest was one of the loosest markets in the country. Rejections ran between 6% and 9% from January through July. Then in August they nearly doubled, and they have climbed almost every week since.
The equipment split explains most of the move. Northwest reefer rejections have averaged 41% so far in October, up from roughly 17% in July and 16% in October of last year. Dry van rejections, by contrast, remain under 5%. Reefer tender volume is up 65% since July and 35% year over year, while van volume has fallen 11% from a year ago. This isn't a broad regional squeeze. It's a specific shortage of temperature-controlled capacity.
Harvest freight meets a thinner fleet
The timing points to the fall produce season. Apple and potato harvests in Washington, Oregon and Idaho ramp up from late August through October, and that freight moves almost entirely in reefers. The pattern isn't new. Last year the same harvest lift showed up too, but it arrived later and was smaller. Northwest rejections didn't break 10% until mid-November and peaked near 13%.
A bigger crop doesn't account for this year's jump. USDA estimates Washington's 2026 apple crop at 176.2 million bushels, down 2% from last year, and the national apple crop is down 7% (The Packer). Fewer apples, yet tighter reefer capacity. That points to the supply of trucks rather than the volume of fruit as the pressure point.
The Midwest tells a different story. Its rejection rate has held near or above 15% since February and currently sits at 18.6%, compared with 7.6% in October of last year. Tender volume in the region is up about 10% year over year, which outpaces the 8% national gain. And unlike the Northwest, the tightness here isn't confined to one equipment type. Midwest van rejections are near 15%, roughly two and a half times last year's level, while reefer rejections are near 29%, up from 15%.
What it means for capacity
My read is that the Northwest spike is a case of seasonal demand meeting a thinner fleet. The region generates relatively little outbound freight for much of the year, so carriers plan around that by avoiding long contract commitments that could leave trucks stranded in a lane they can't easily leave. When harvest freight arrives in volume, there simply isn't enough capacity already positioned to cover it. Because the surge is tied to the harvest window, it should ease as the season winds down this winter. Here's the thing, though: the same capacity decisions that create the spike also explain why it can't be absorbed quickly.
The Midwest matters more for the national picture. It's the largest freight region in the country, and it's running about five points above the national rejection rate while volume keeps growing. That makes it a longer-term signal rather than a seasonal one. The region has plenty of freight, and carriers have struggled with tender compliance there for close to a year. Even as the national figure has come down, Midwest rejections remain close to their spring and summer highs. Little improvement is visible yet.
The Southeast and Southwest are following a different playbook. Shippers in those regions have leaned on intermodal, and domestic intermodal volume through the Atlanta and Dallas hubs was up 15% to 20% year over year in the most recent week. That shift began over the summer, around the time rejections in those regions peaked. Rail-truck combinations are taking freight that might otherwise have gone to over-the-road trucks, which helps explain why those regions have cooled.
Watch the Northwest reefer numbers as harvest volume tapers, and watch whether the Midwest can bring its van and reefer rejections down together. A regional spike can fade on its own. A region that stays tight across equipment types is usually telling you something about how capacity has been allocated over a longer stretch.
About the Chart of the Week
The Chart of the Week is a selection from SONAR, the freight market data platform that aggregates information from hundreds of sources and presents it in charts, maps and commentary. Each week, a market expert highlights one chart as a useful reference point for understanding current conditions. The chart is then archived for later comparison.